MENA Startup Market Reference
This survey was conducted in 2022
Starting a tech startup in MENA has its challenges, one of which is knowing what is the standard practice for salaries, valuation, structure and many others questions one needs to know when they are running their own startup, and we, as founders, end up relying on data from startups based in the US or other worldwide references which don’t always translate well in the region’s common practice.
Check out Jawlah’s Analysis on the data shared below
- Pre-seed
- Seed
- Series A
- Series B+
Sample Demographic
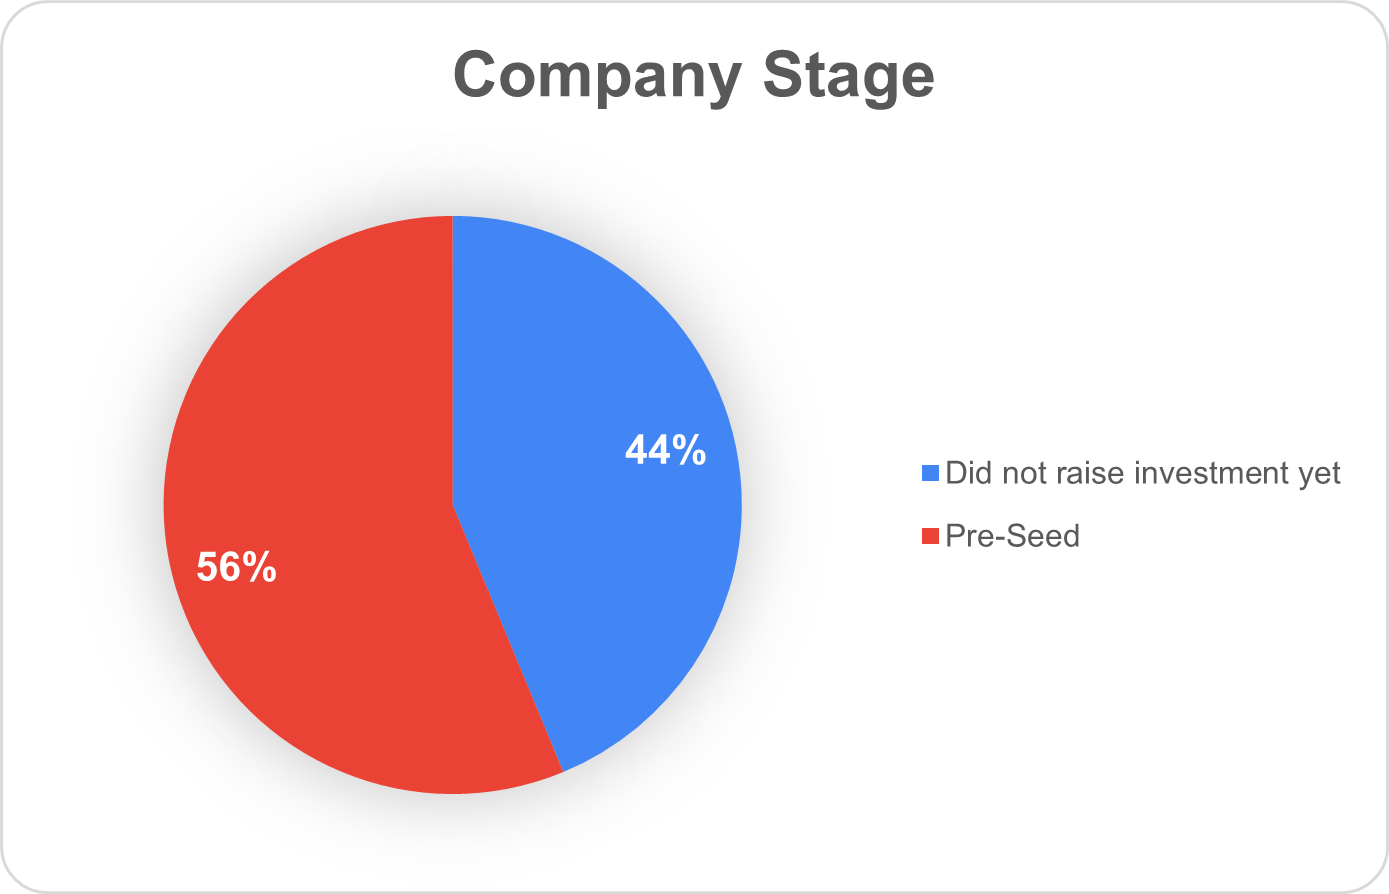
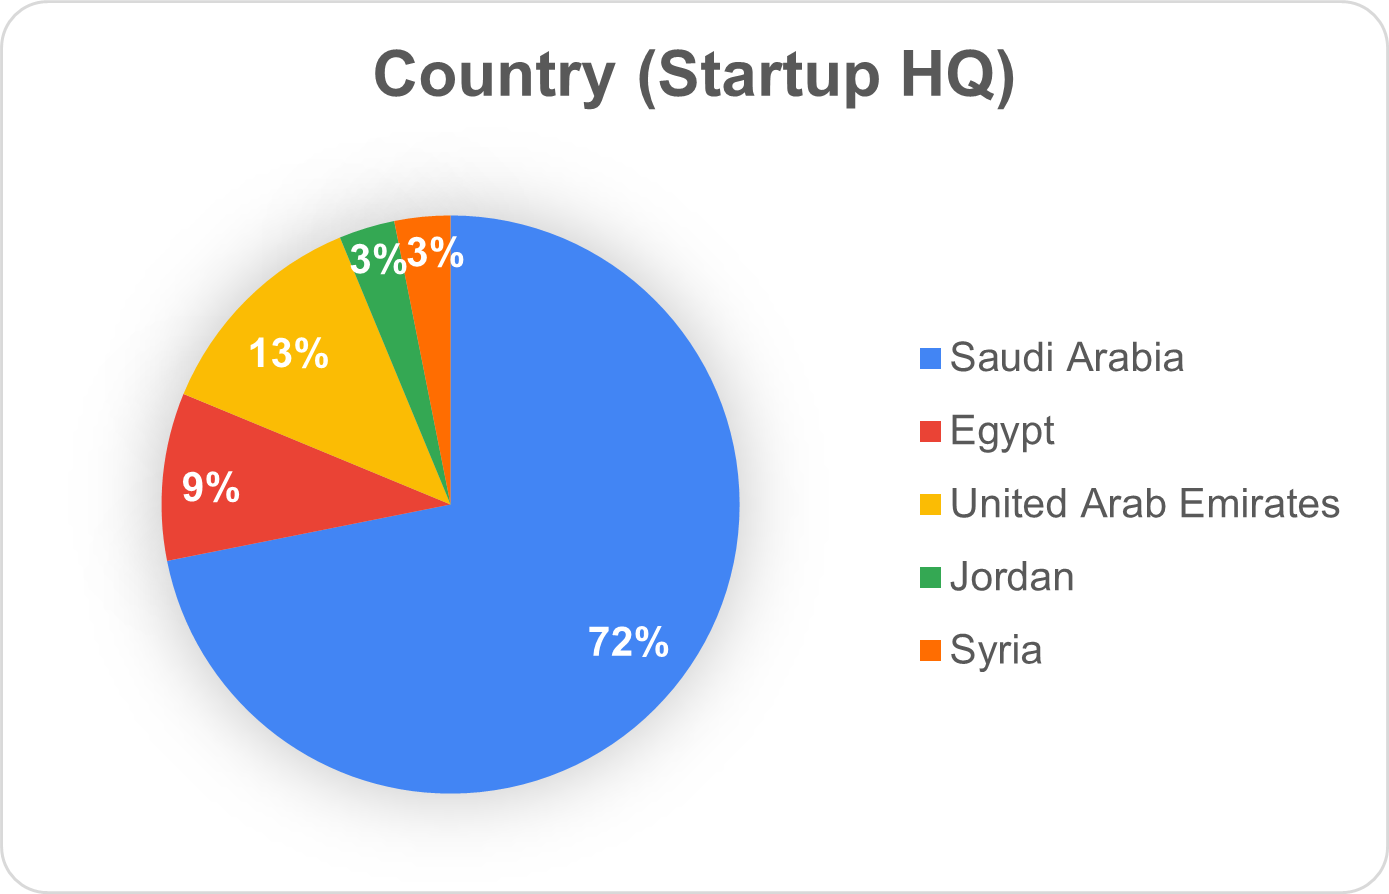
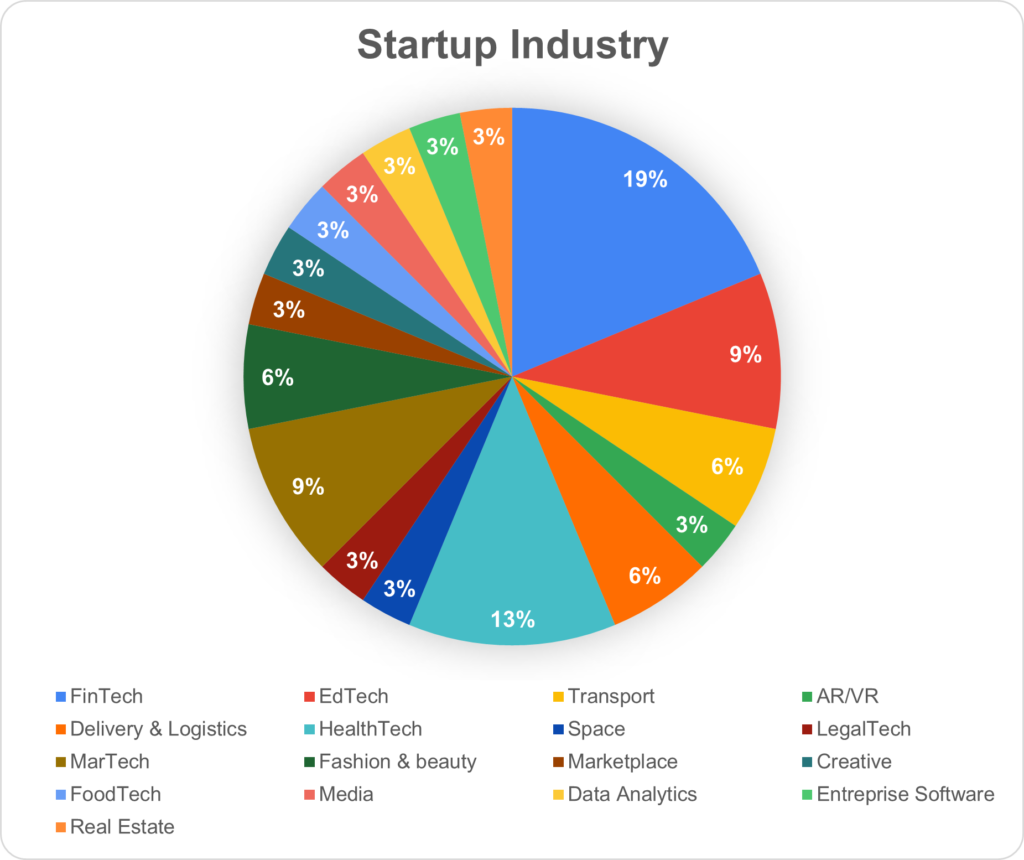
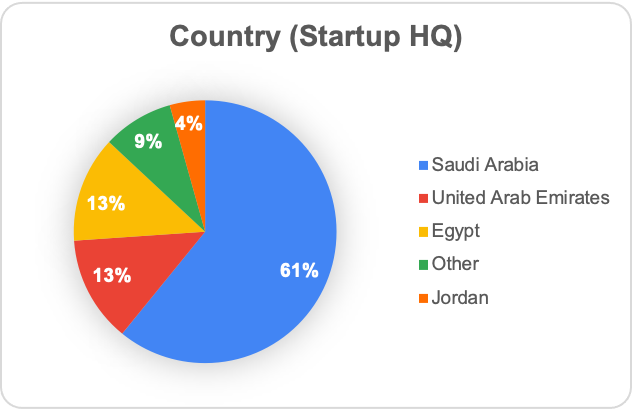
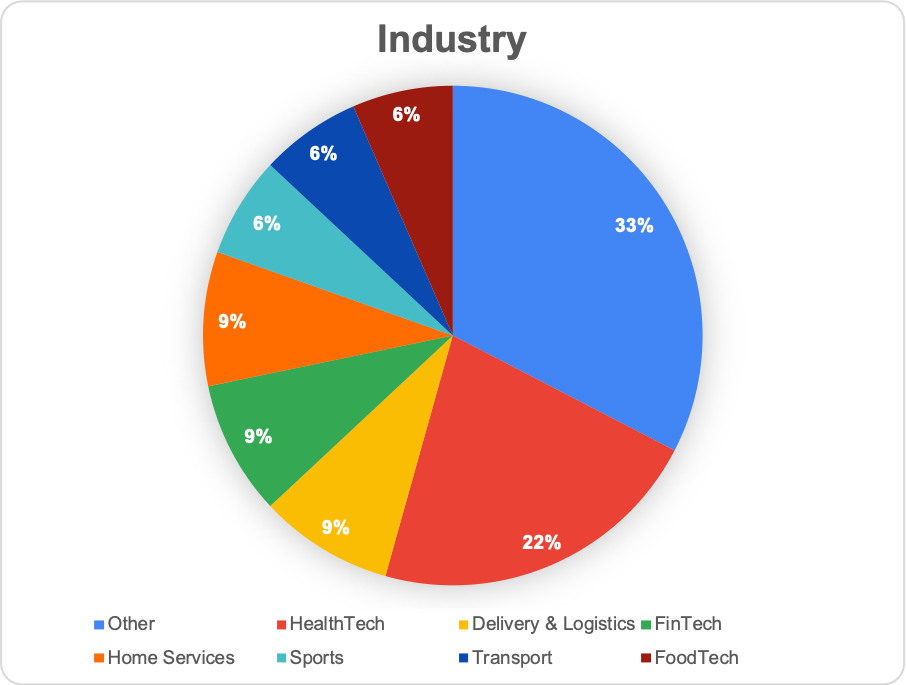
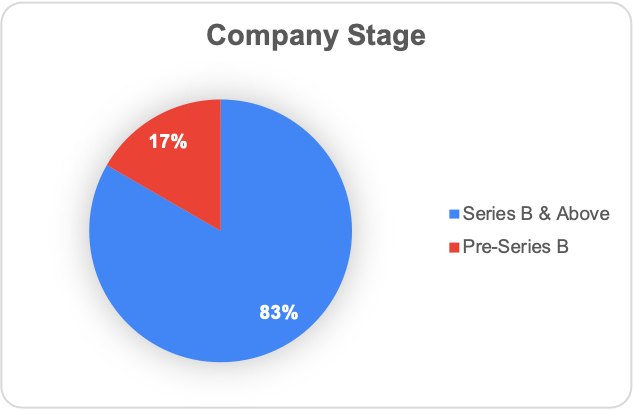
These charts show the type of startups that filled the survey to better understand who they are, from where, and which industry.
Investment Details
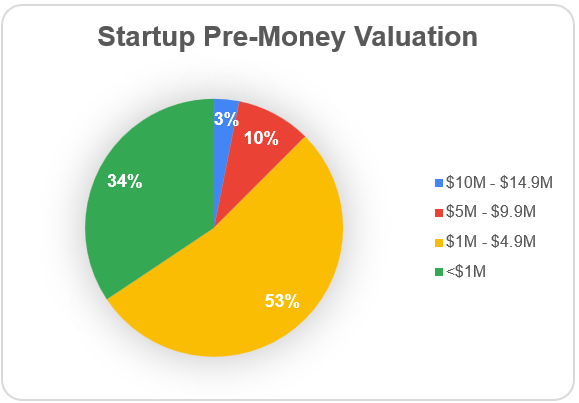
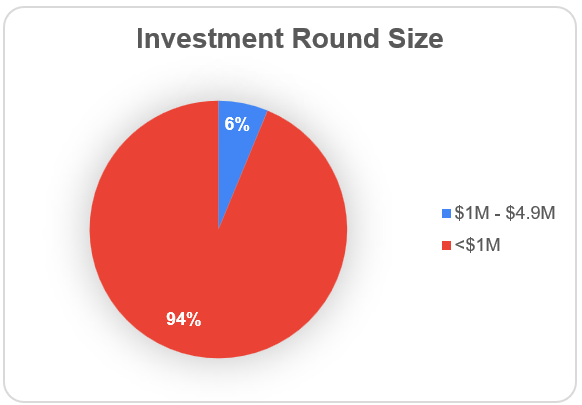
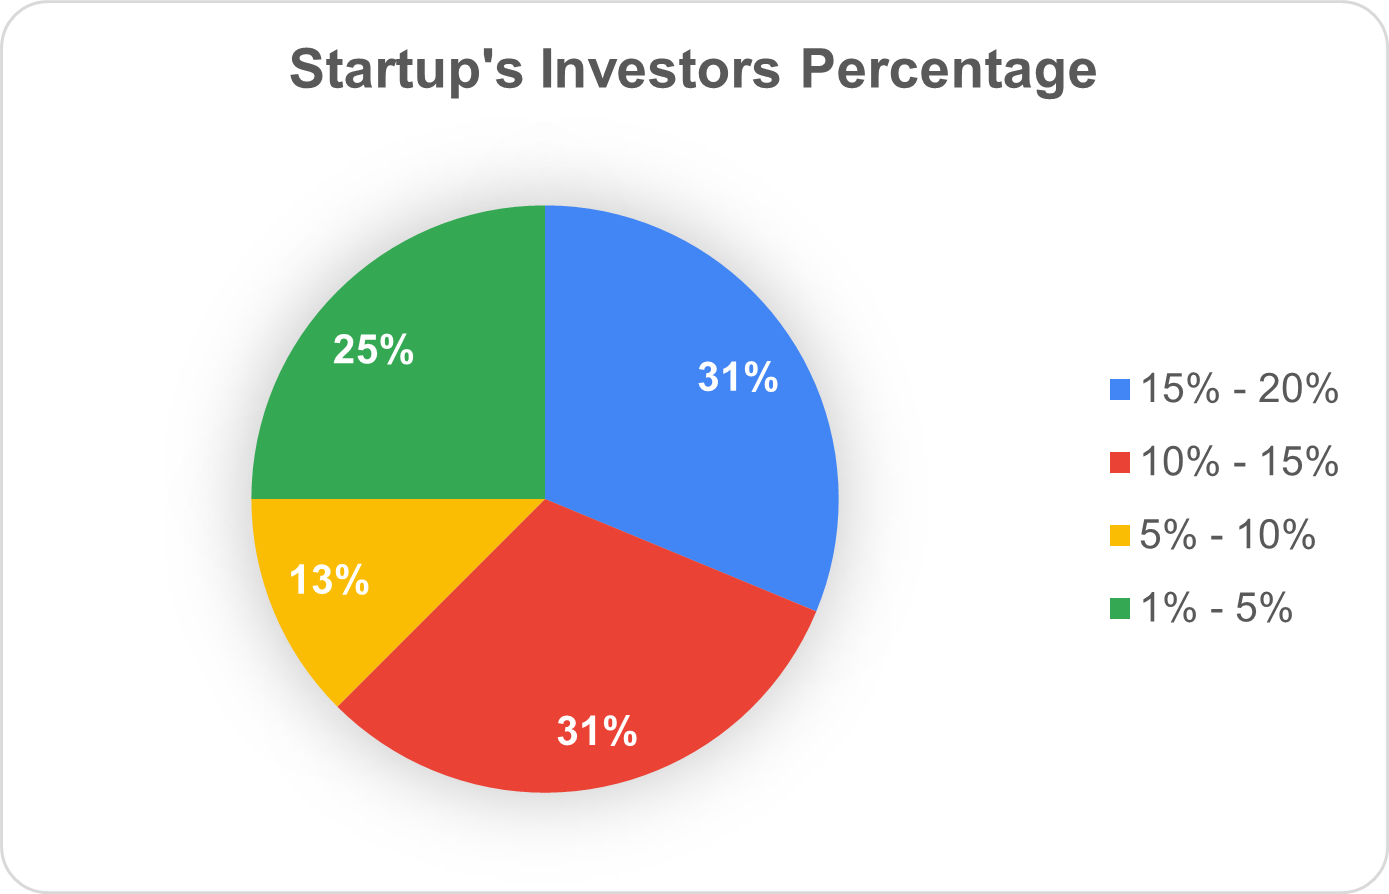
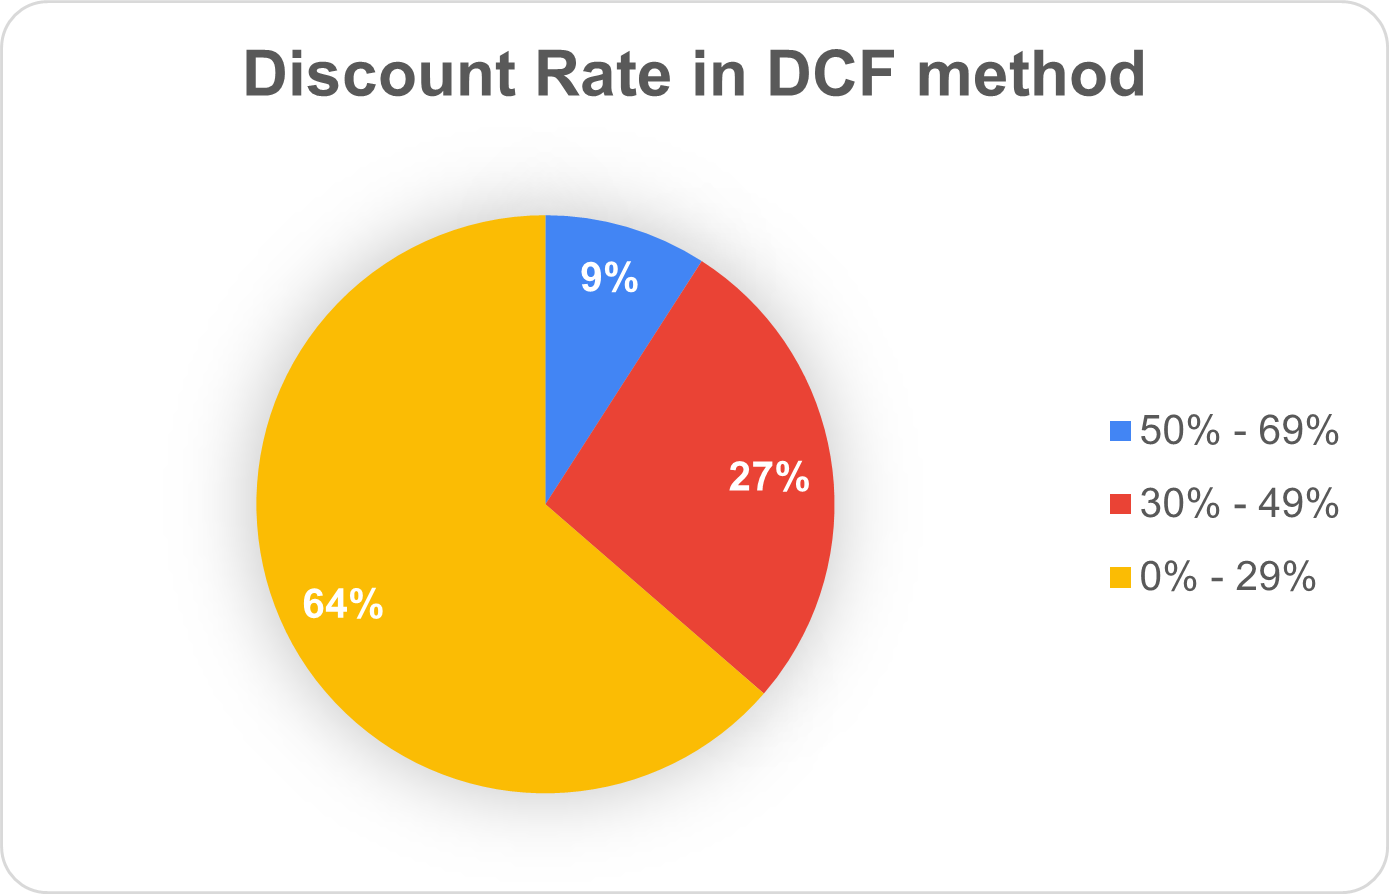
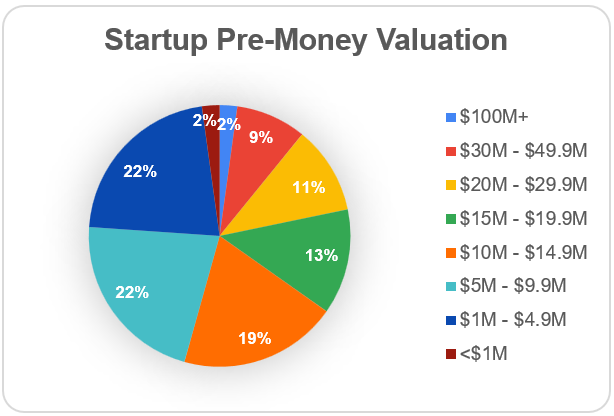
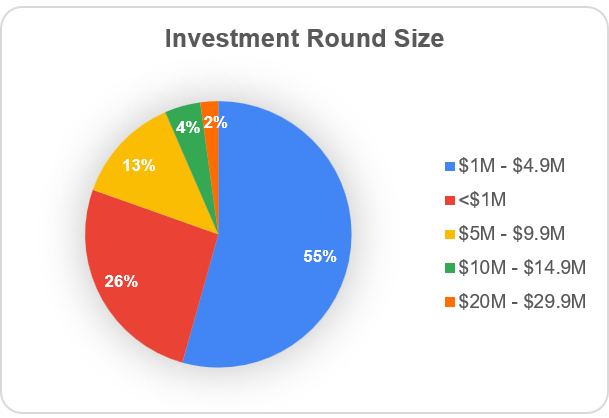
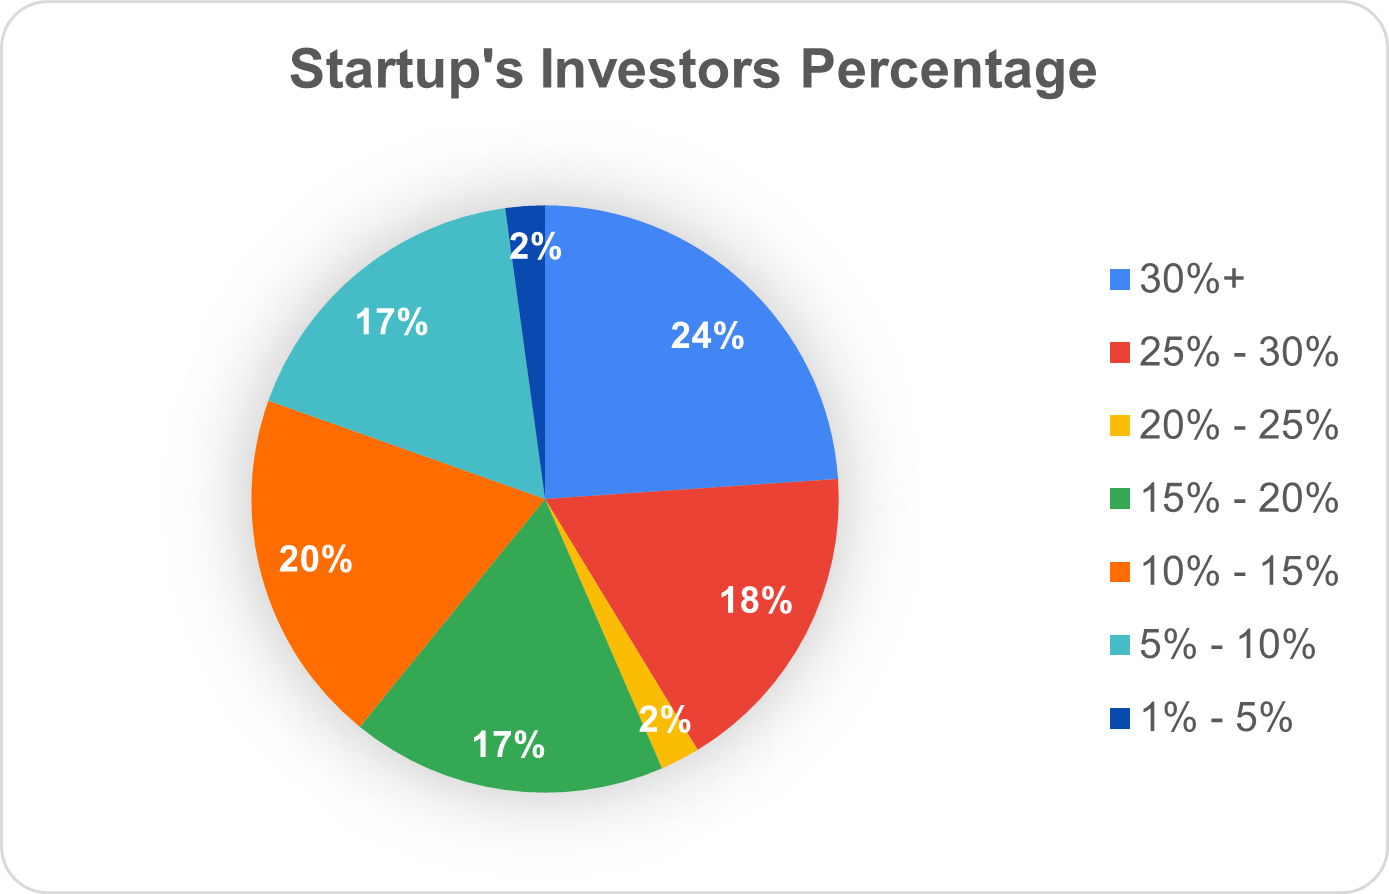
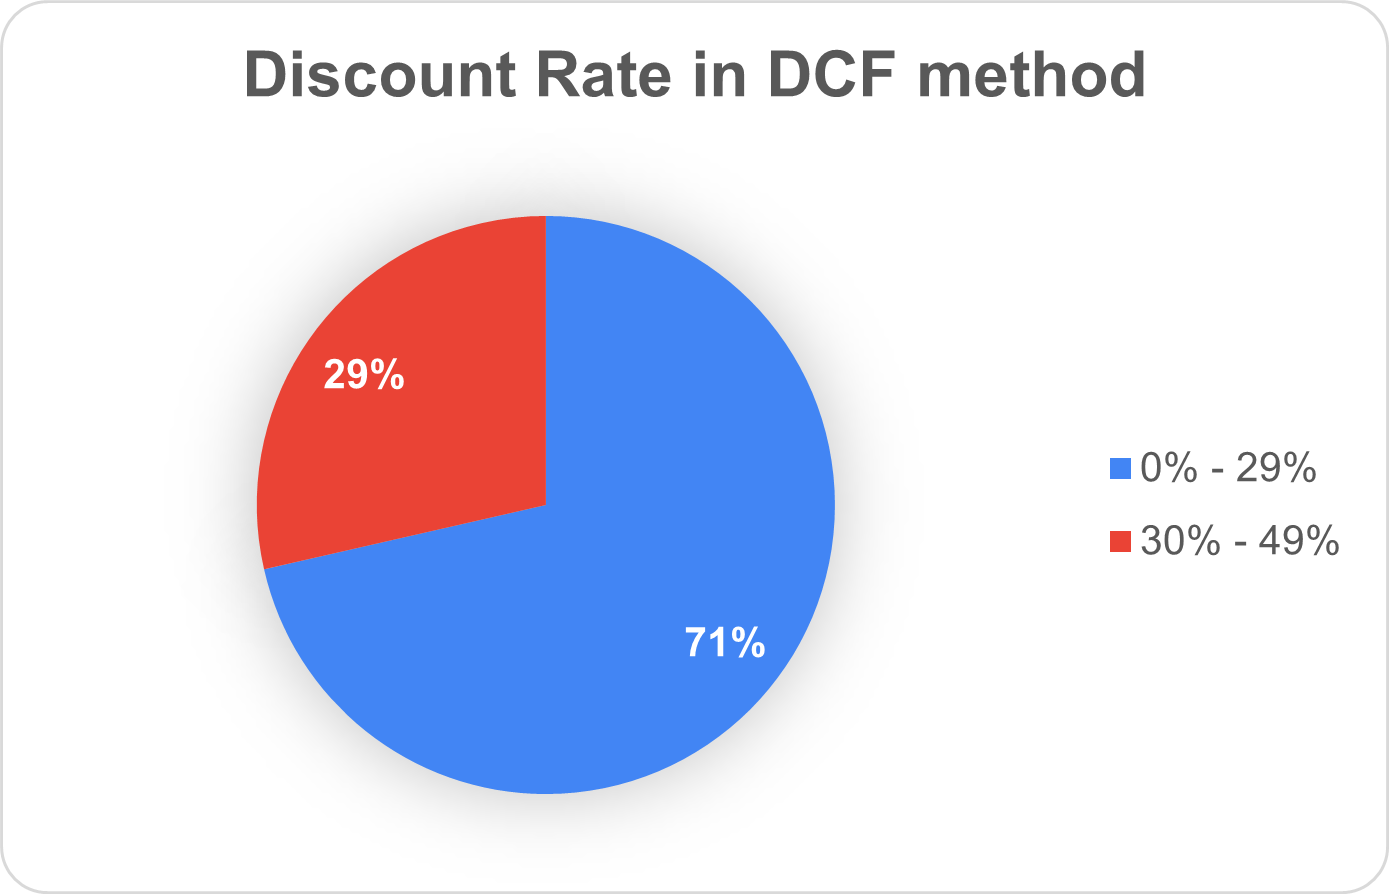
The following charts shows the average size of investments, pre-money valuations in the market, and how much investors own of the startup at this stage.
Startup Structure & Operations
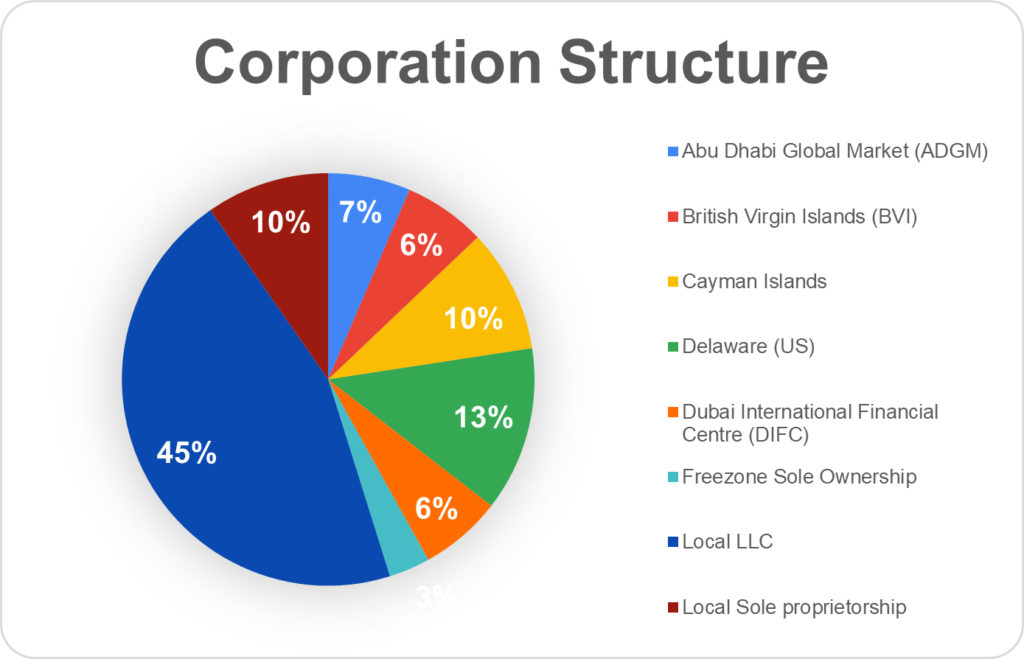
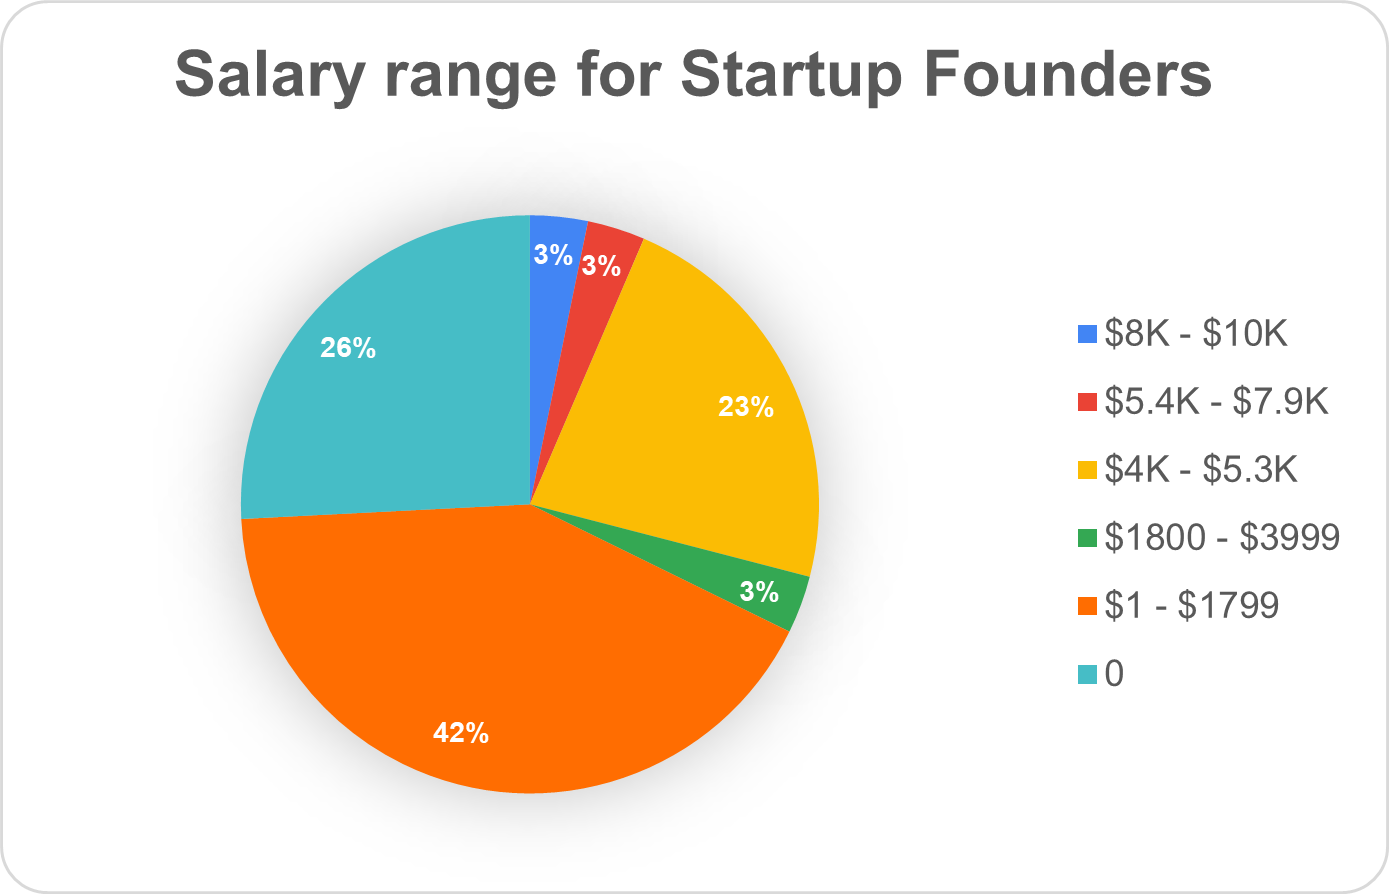
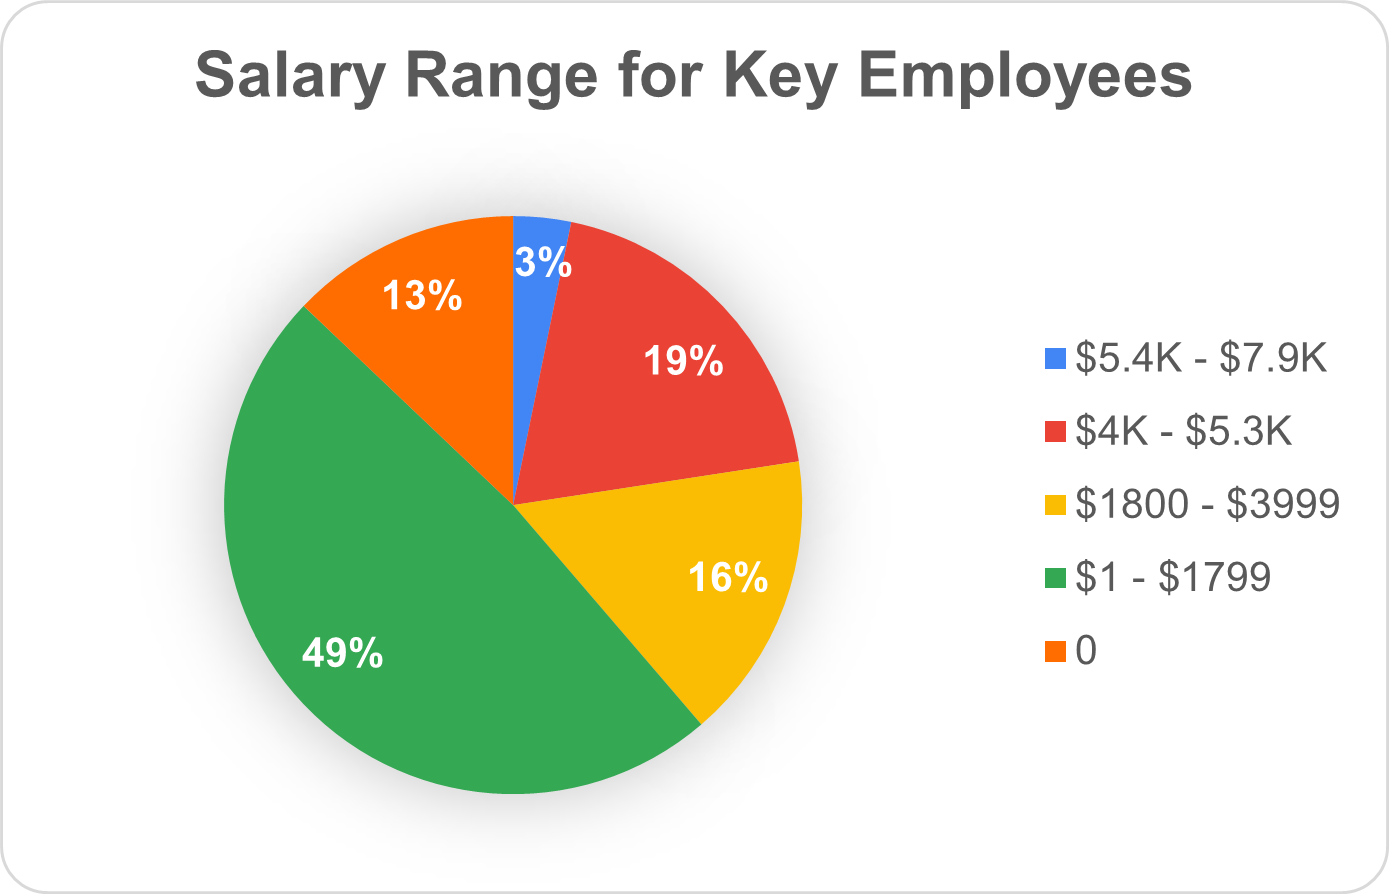
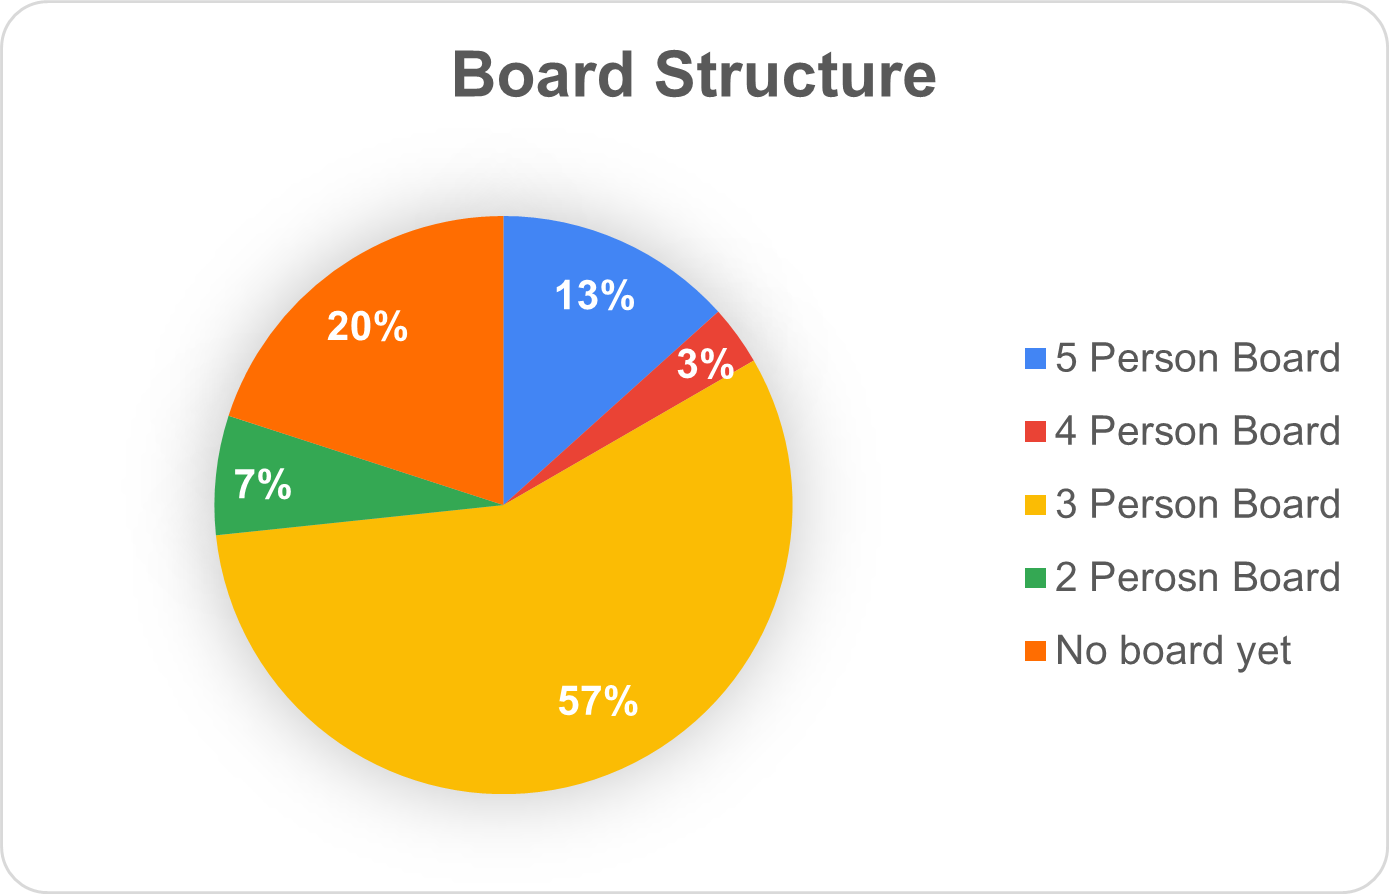
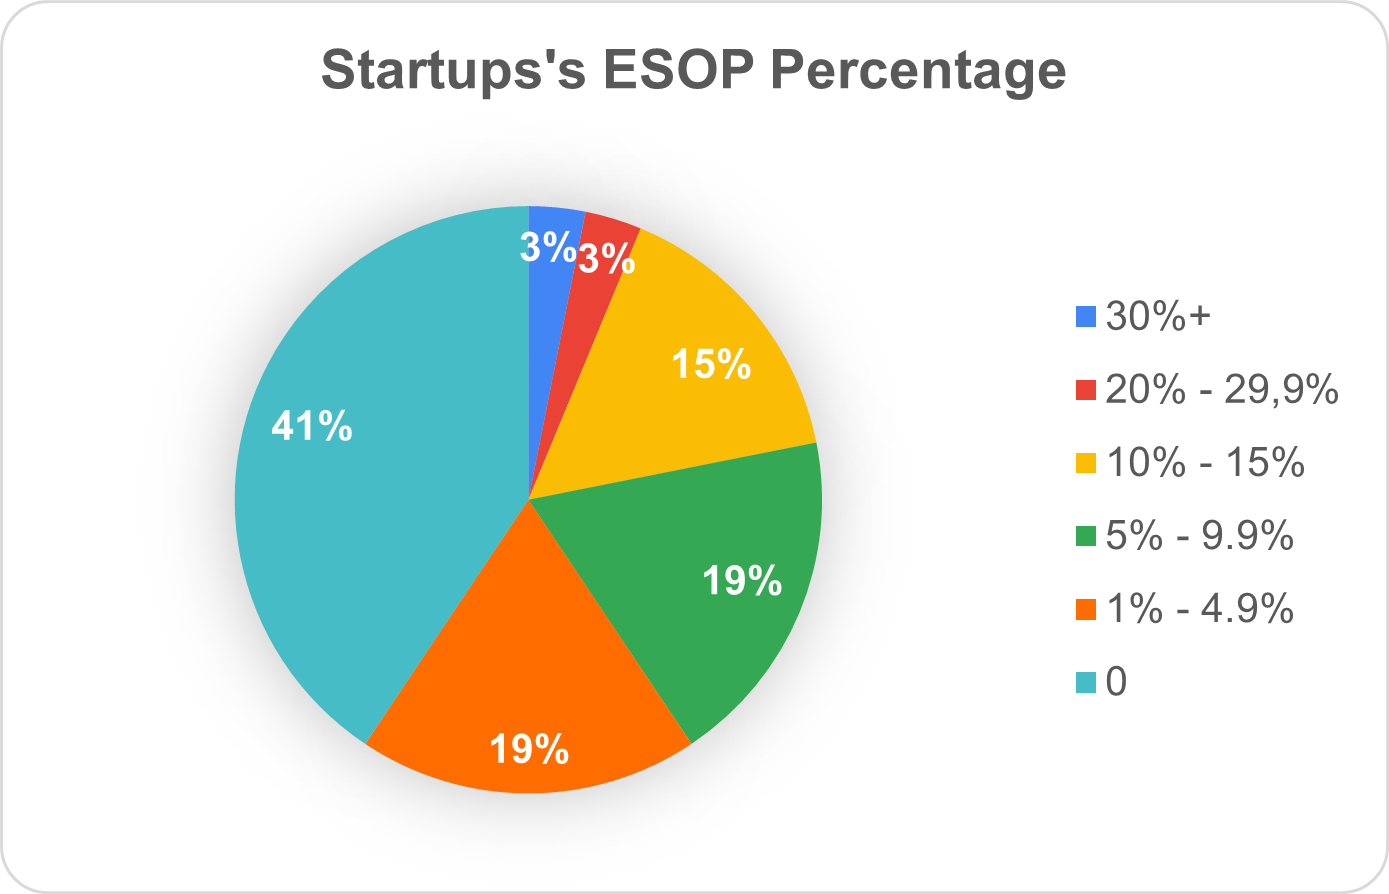
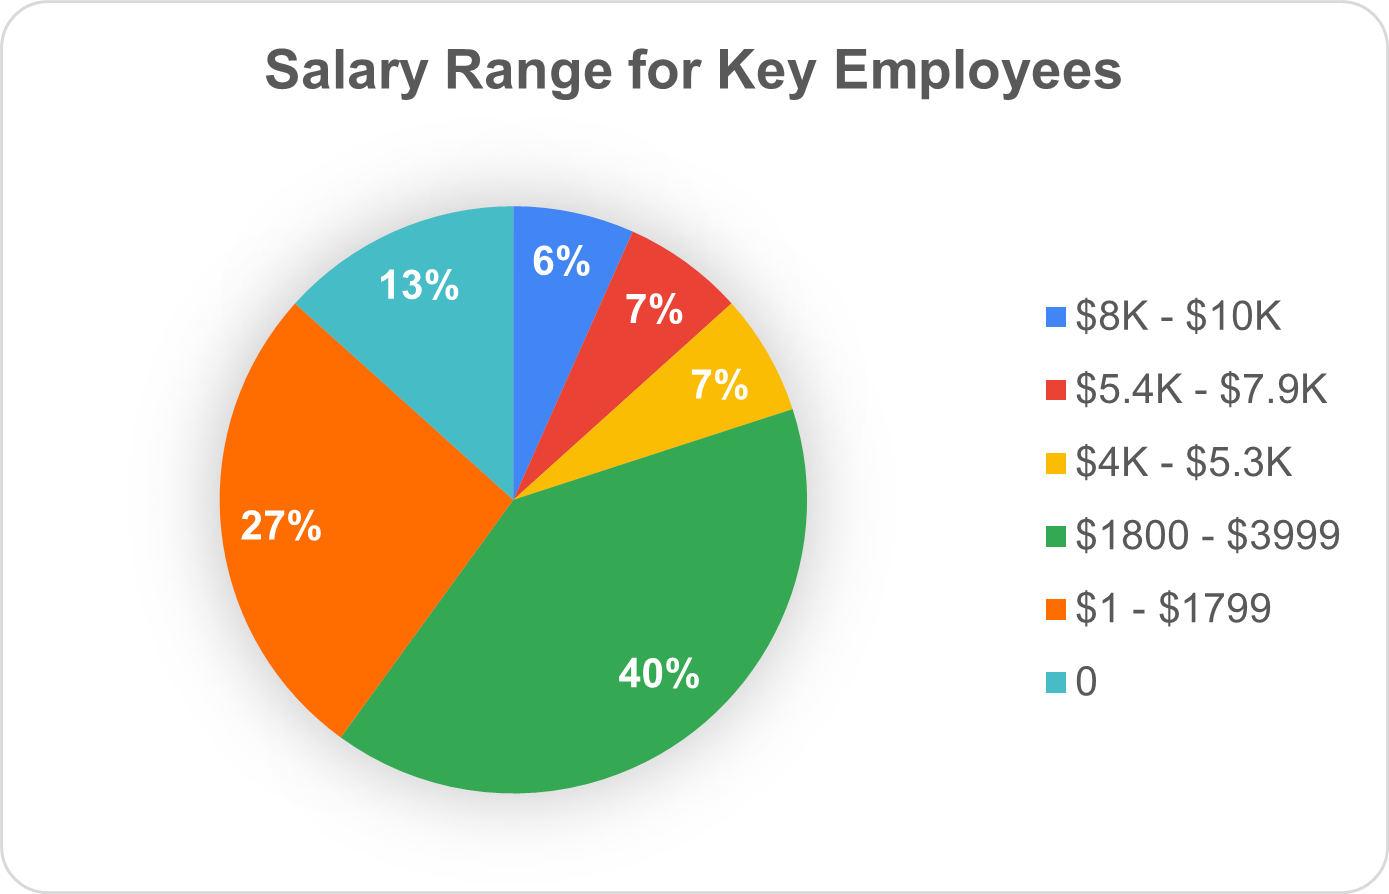
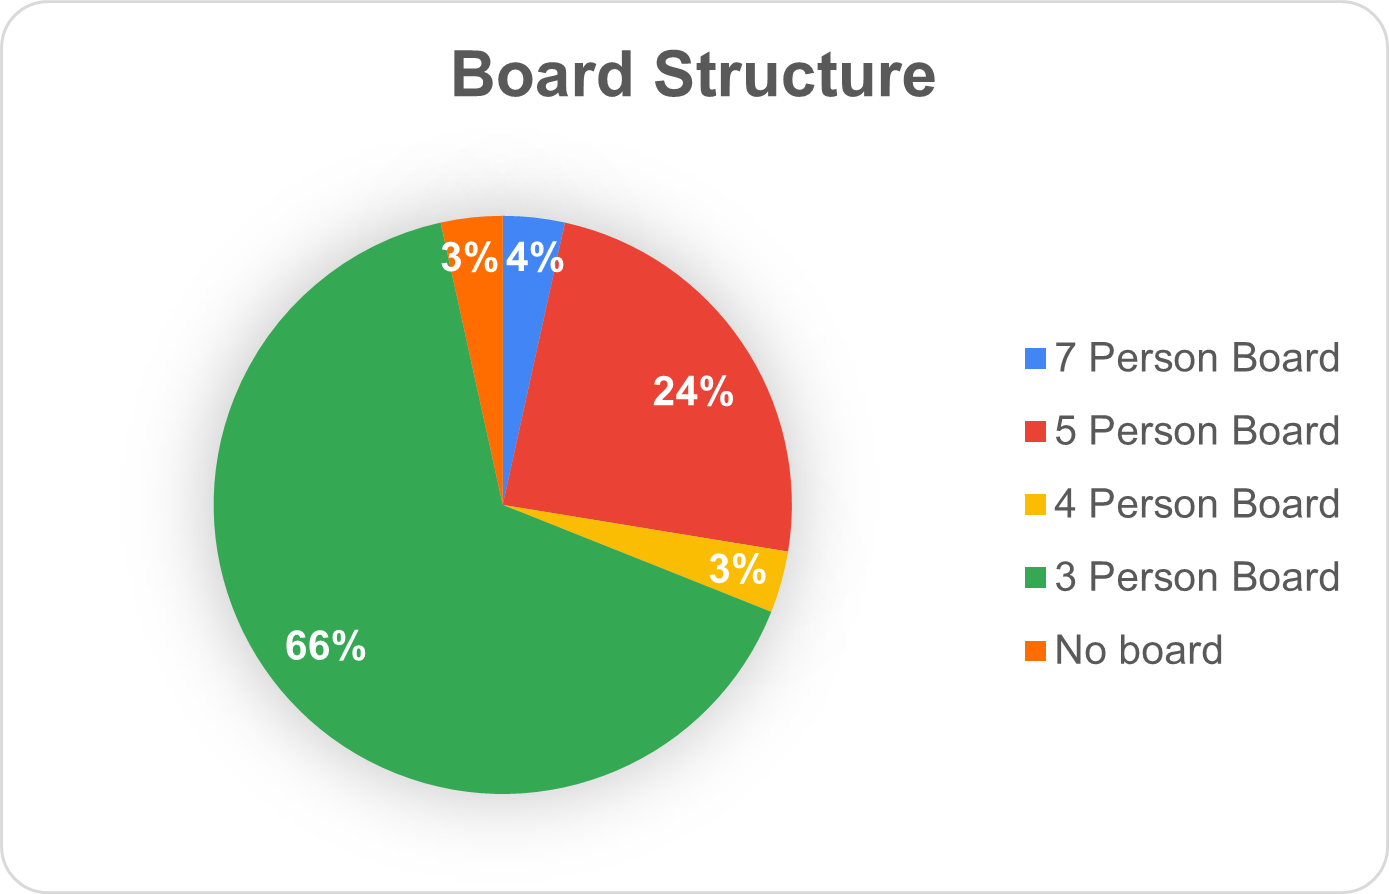
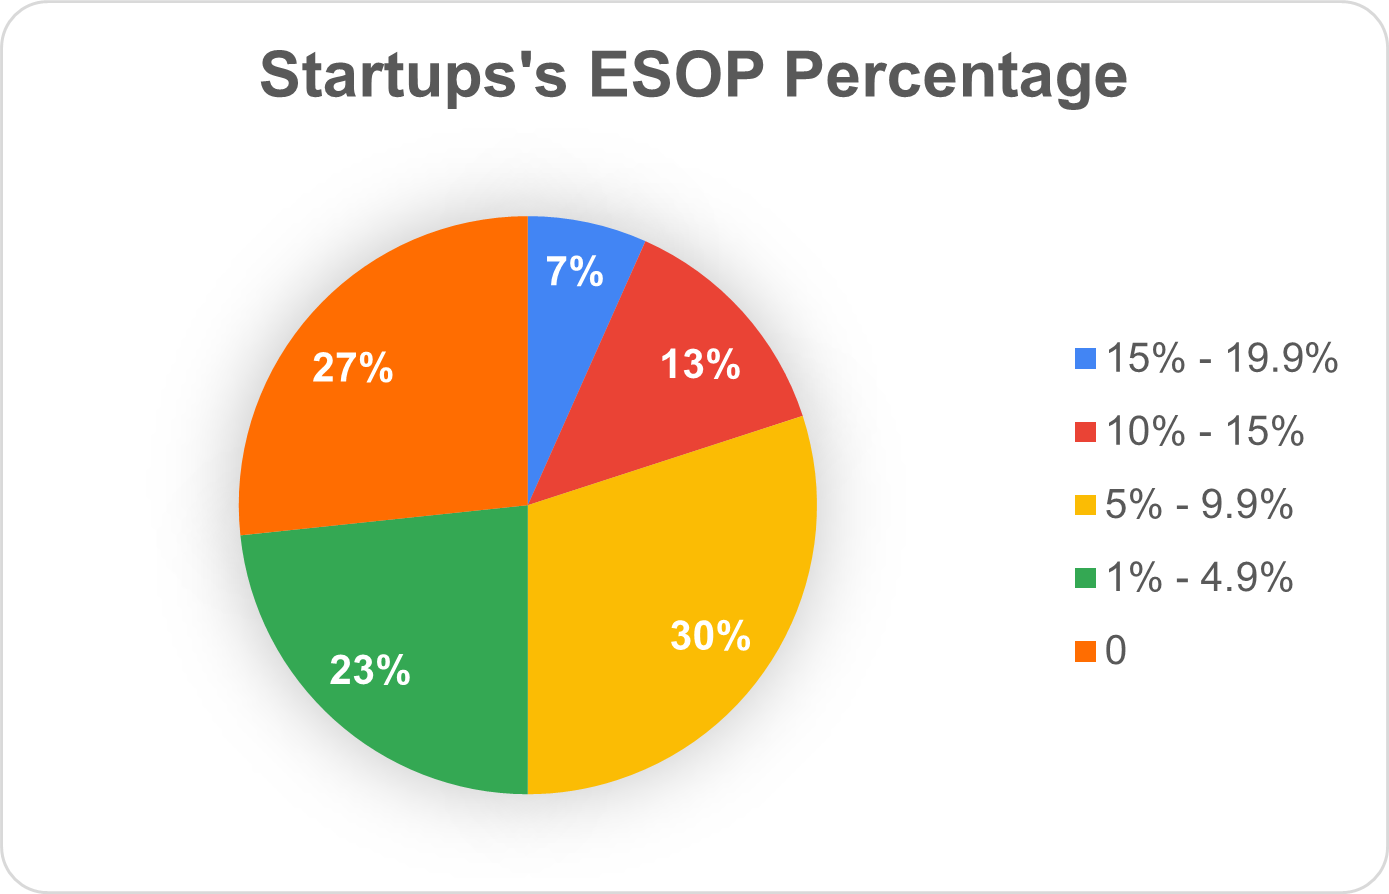
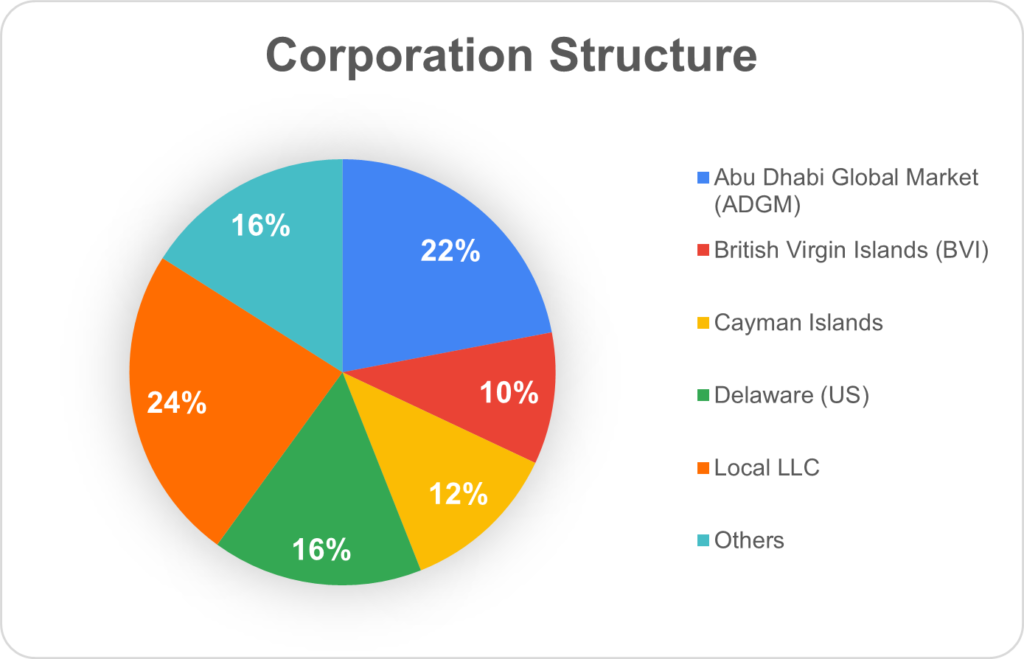
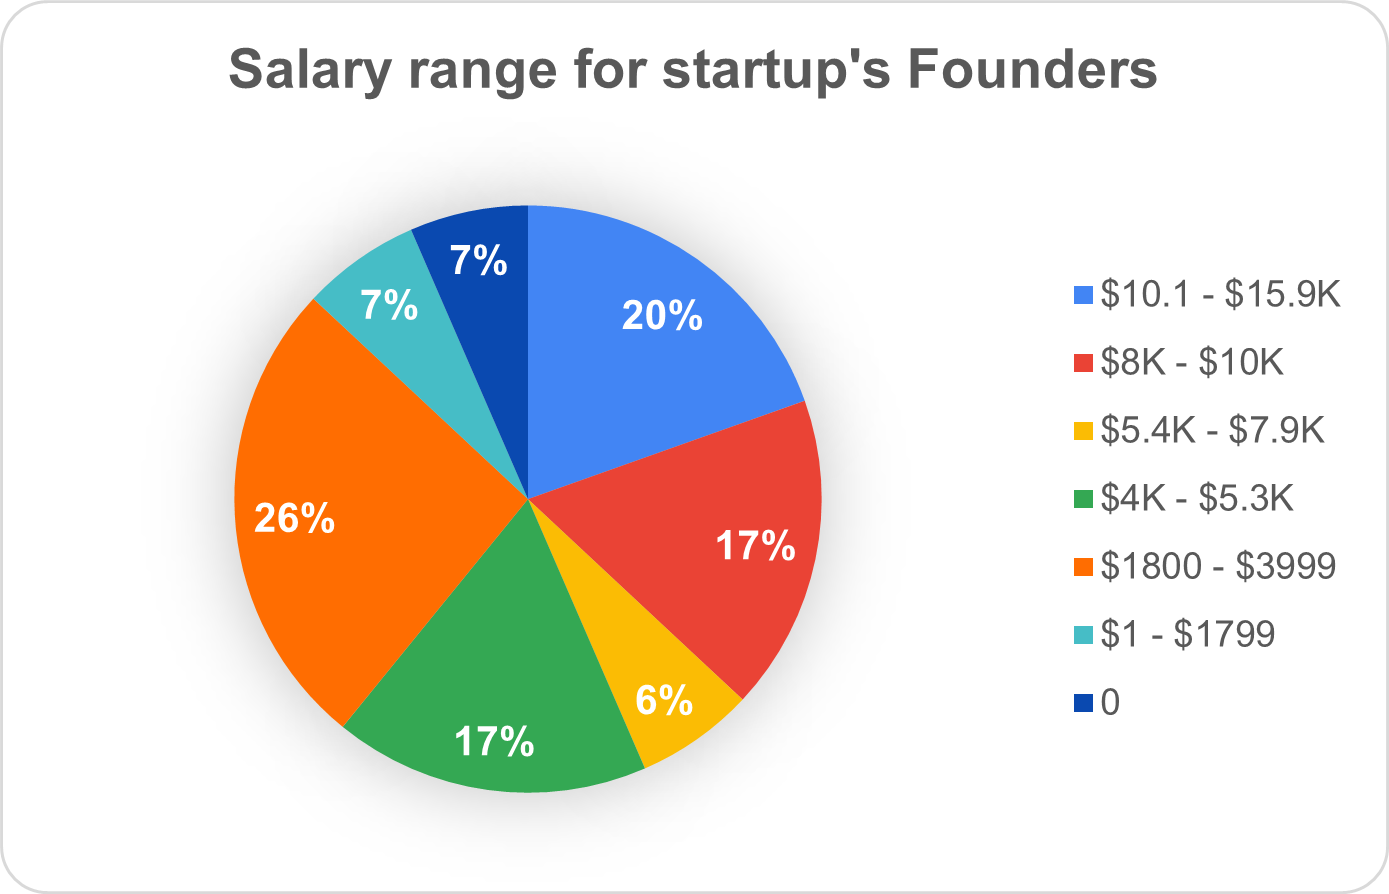
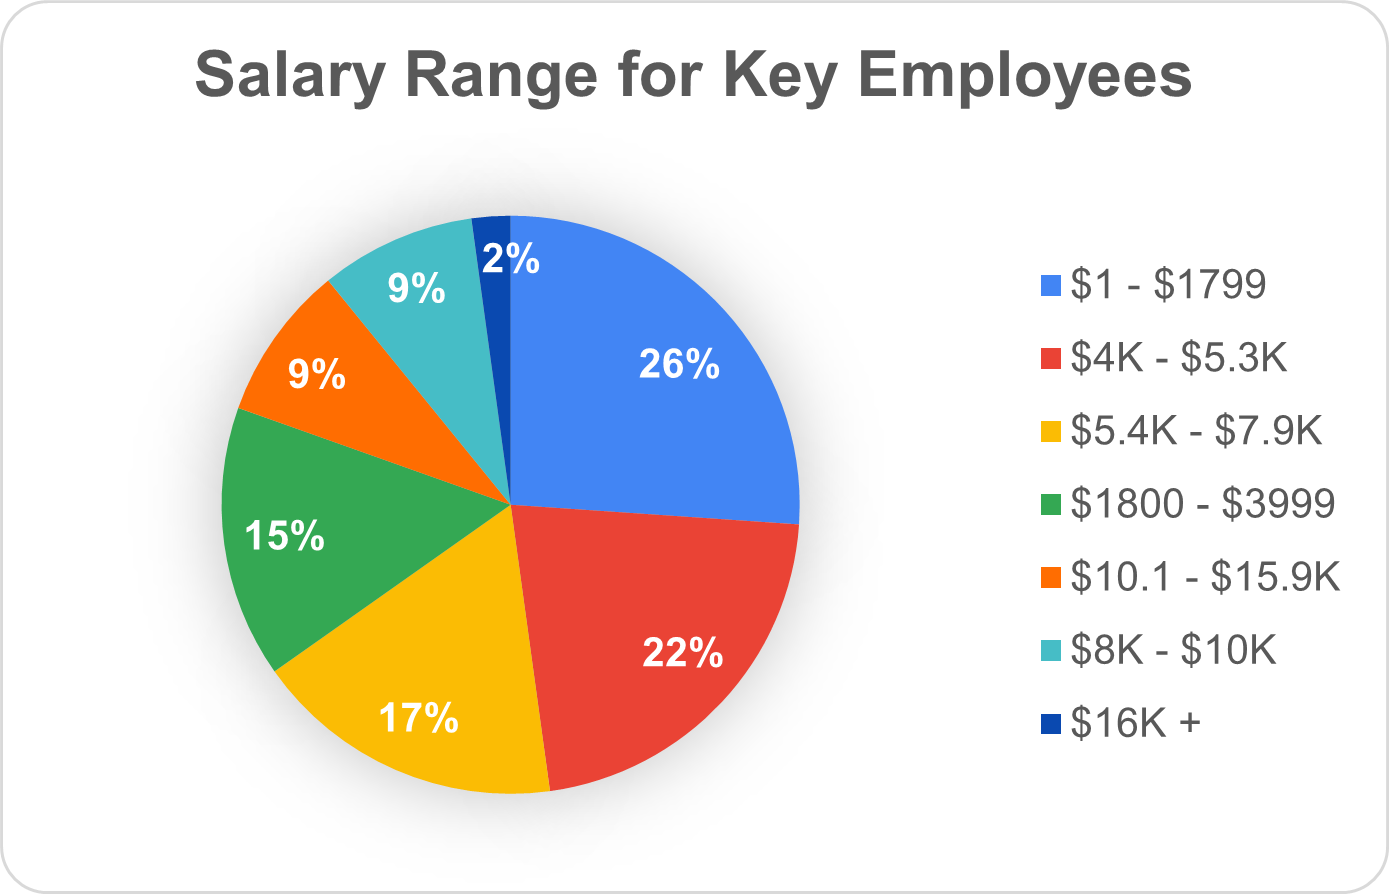
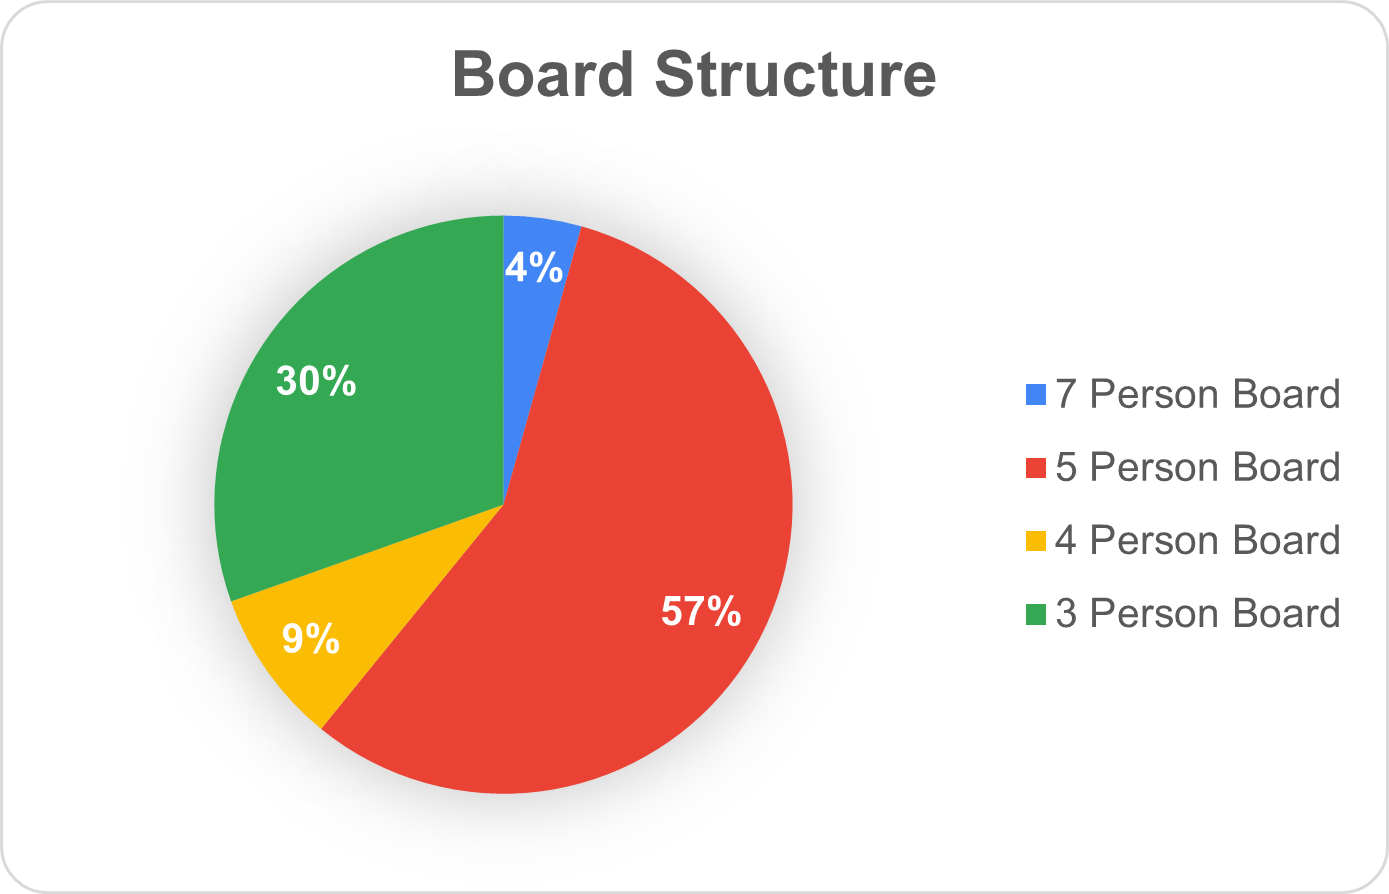
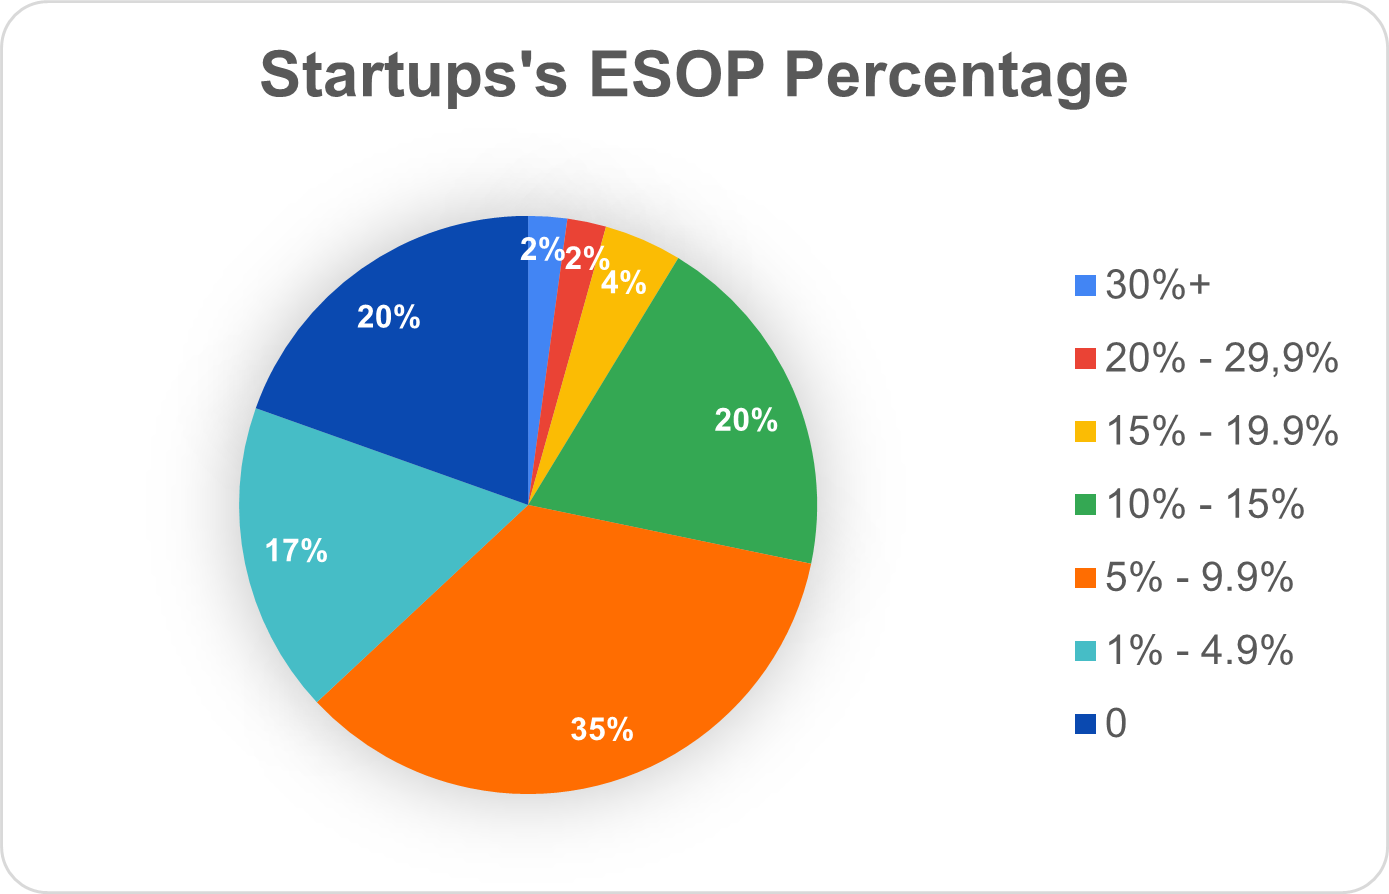
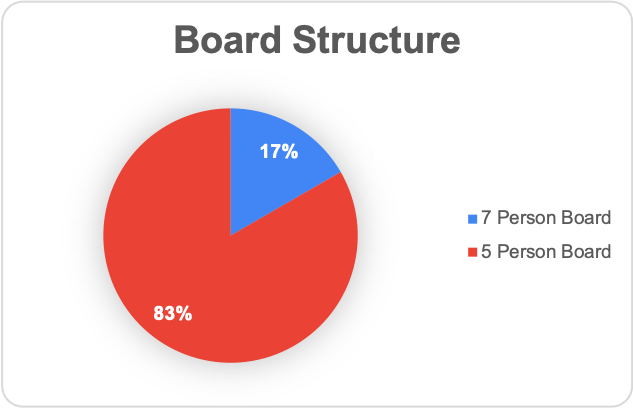
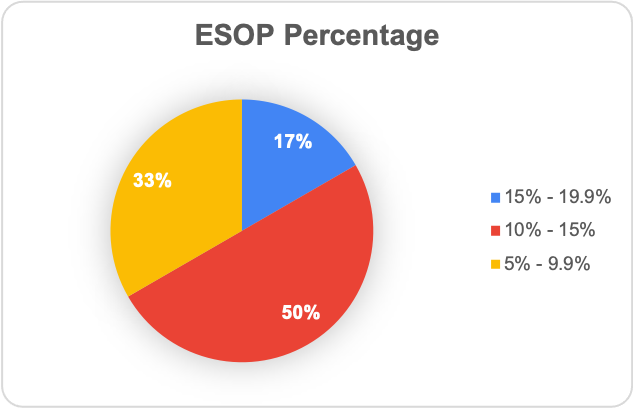
These charts show common practices by startups when it comes to corporate structures , average salaries for founders & key employees, board structure sizes, and ESOP percentages in the startups.
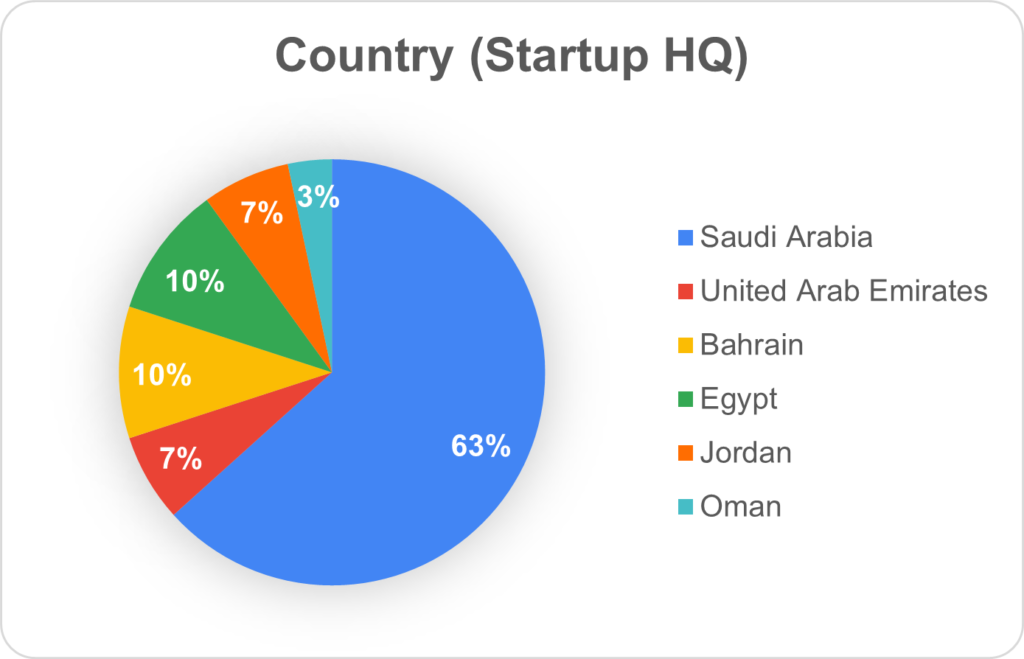
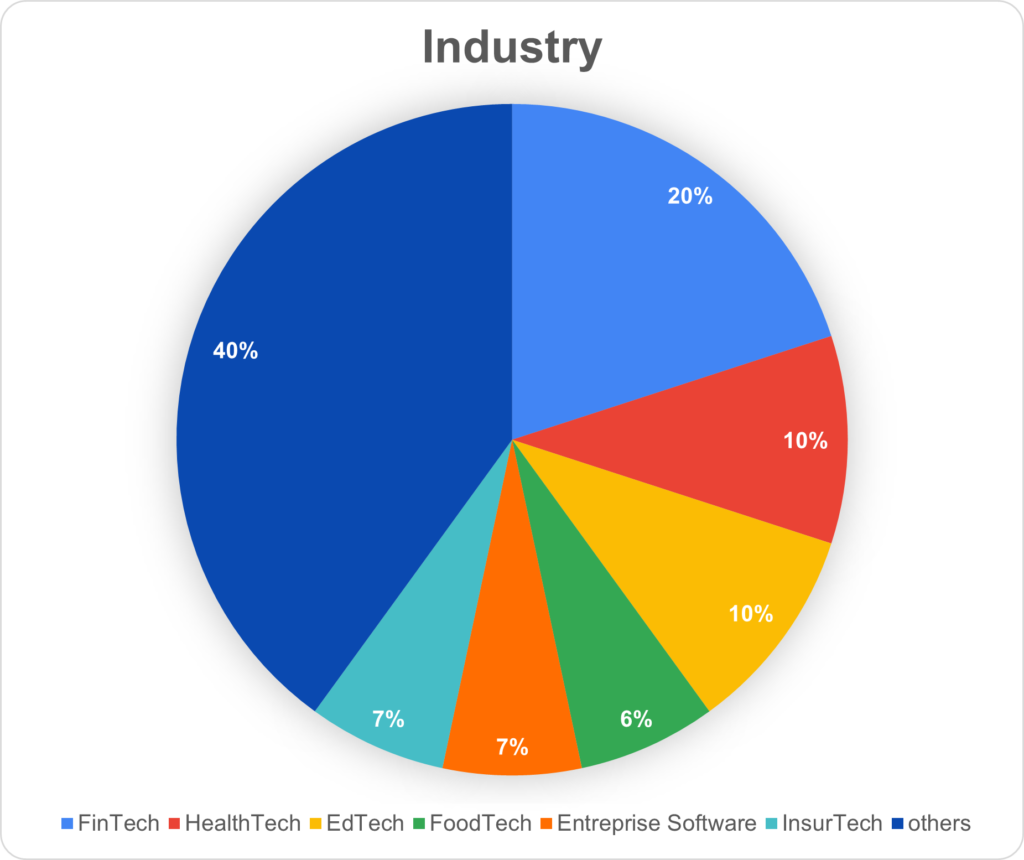
Sample Demographic
These charts show the type of startups that filled the survey to better understand who they are, from where, and which industry.
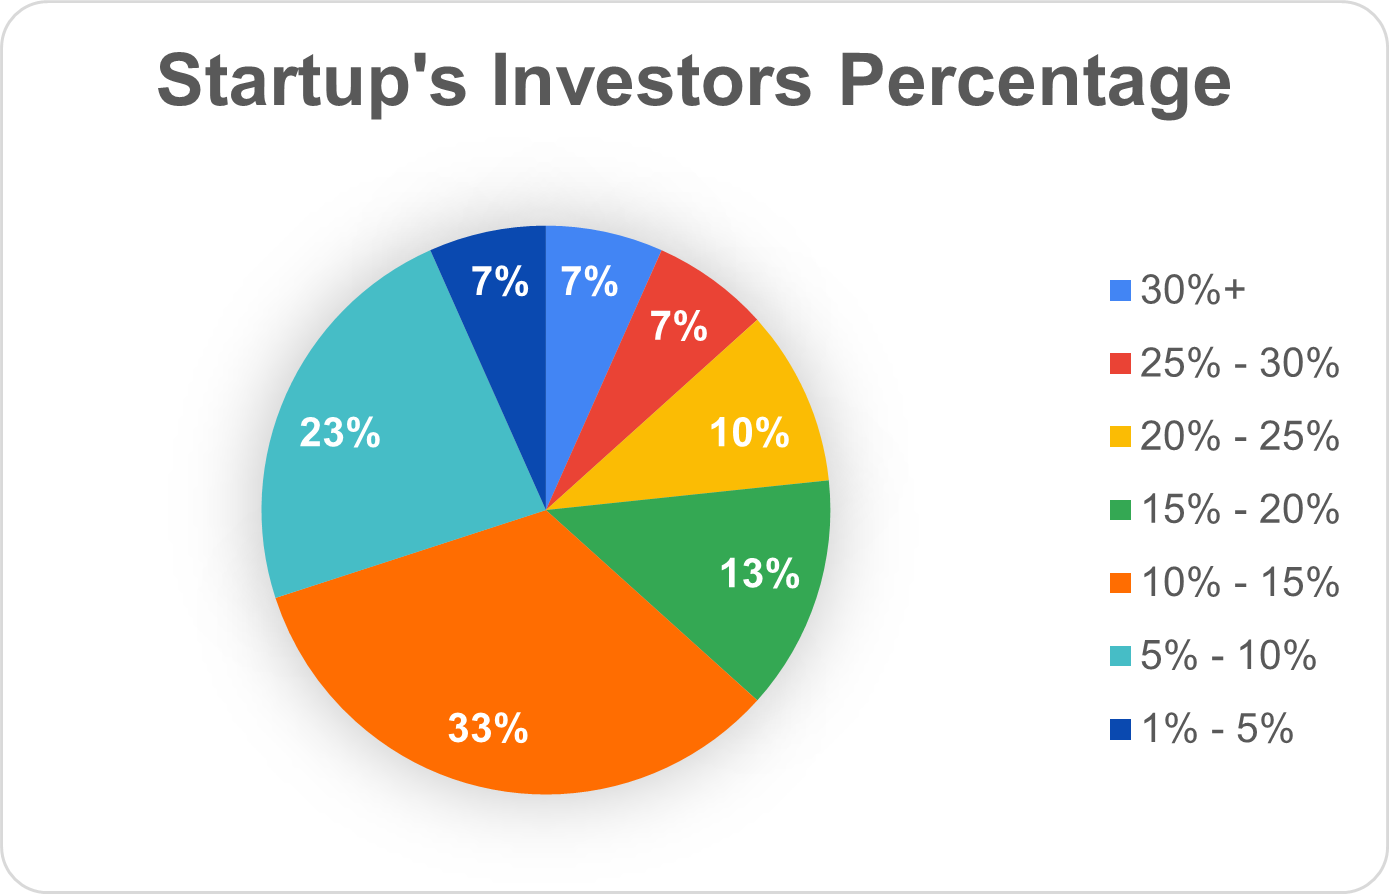
Investment Details
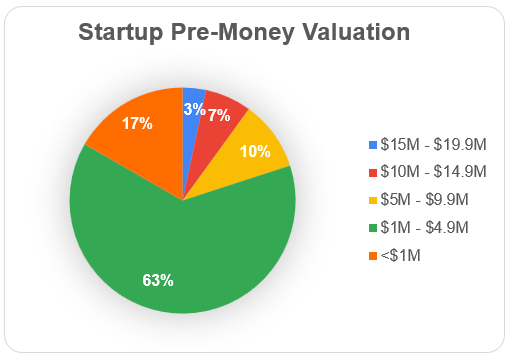
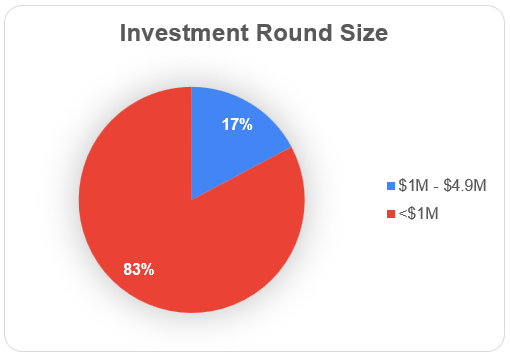
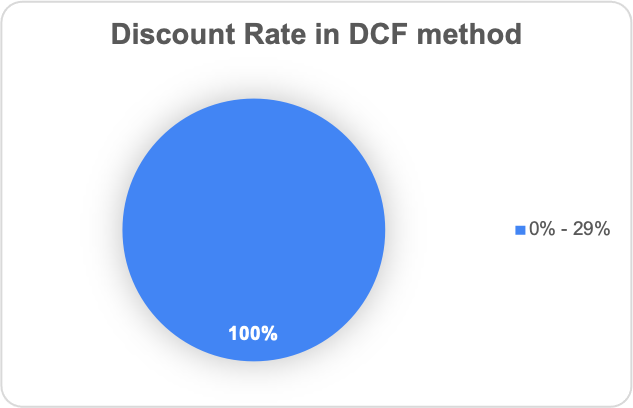
The following charts shows the average size of investments, pre-money valuations in the market, and how much investors own of the startup at this stage.
Startup Structure & Operations
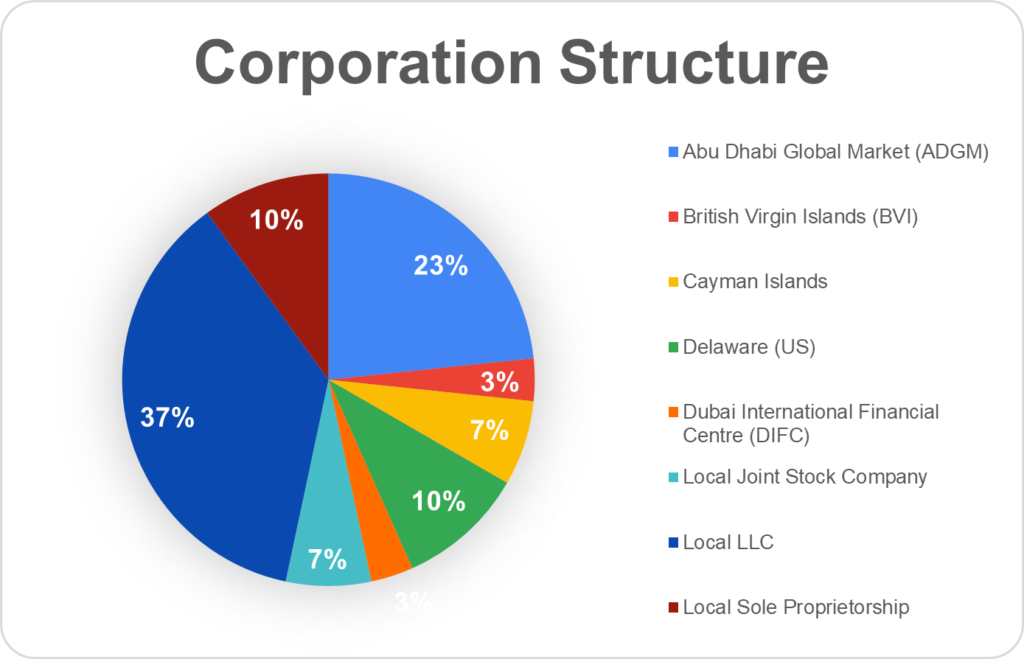
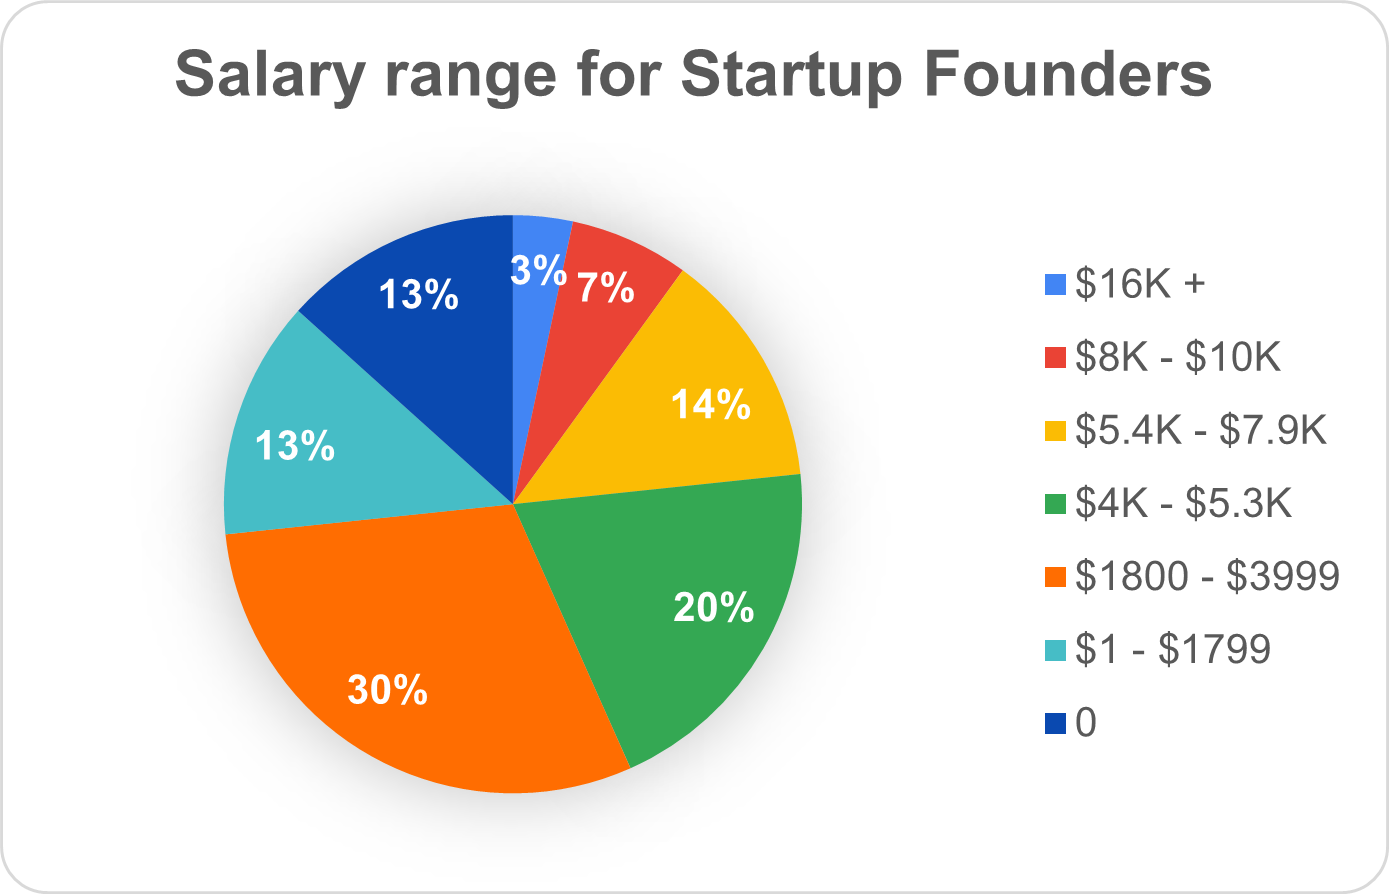
These charts show common practices by startups when it comes to corporate structures , average salaries for founders & key employees, board structure sizes, and ESOP percentages in the startups.
Sample Demographic
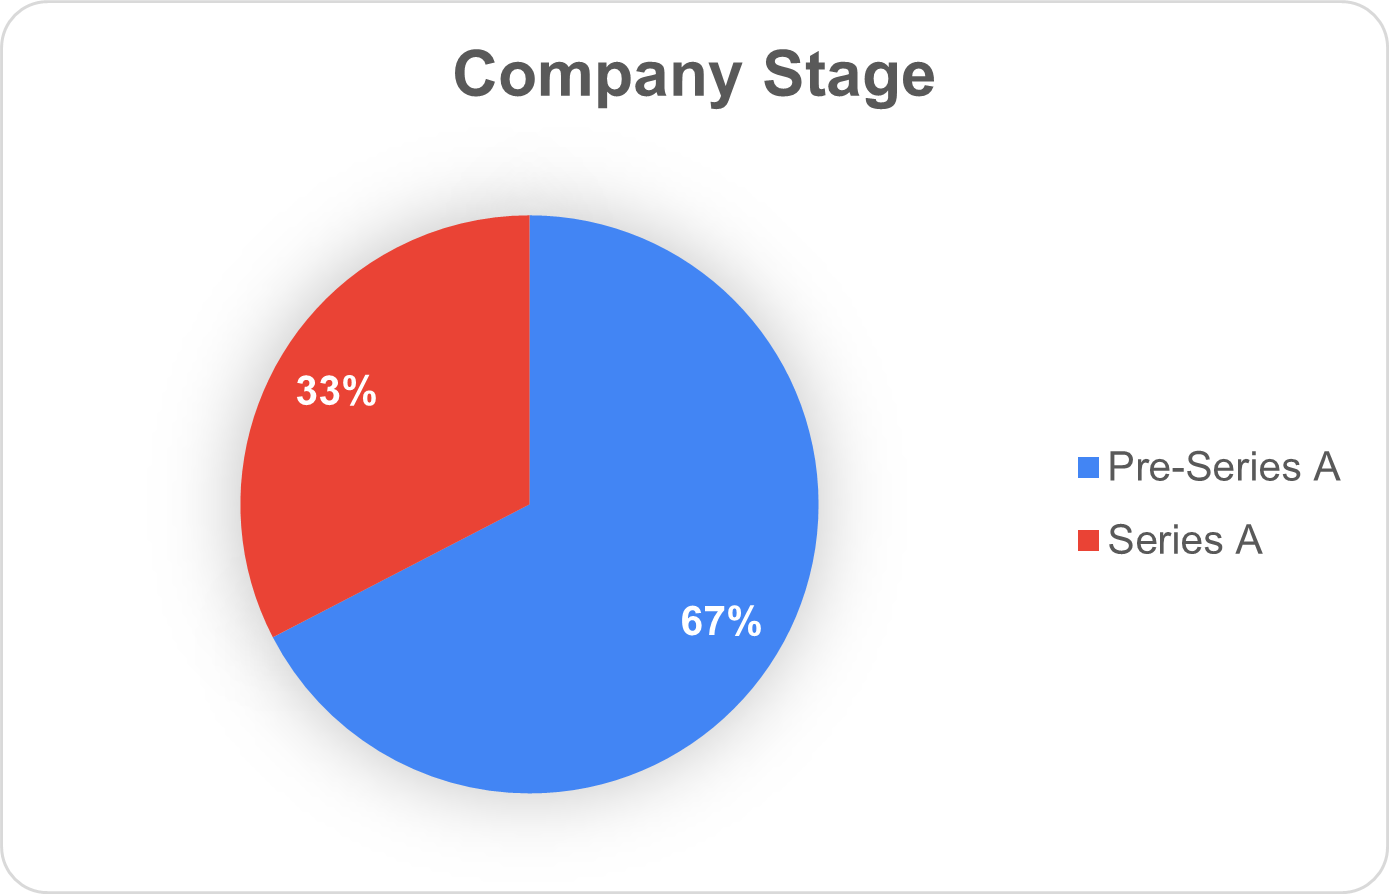
These charts show the type of startups that filled the survey to better understand who they are, from where, and which industry.
Investment Details
The following charts shows the average size of investments, pre-money valuations in the market, and how much investors own of the startup at this stage.
Startup Structure & Operations
These charts show common practices by startups when it comes to corporate structures , average salaries for founders & key employees, board structure sizes, and ESOP percentages in the startups.
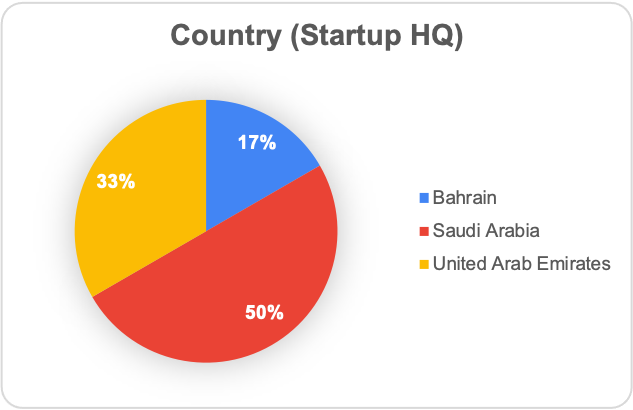
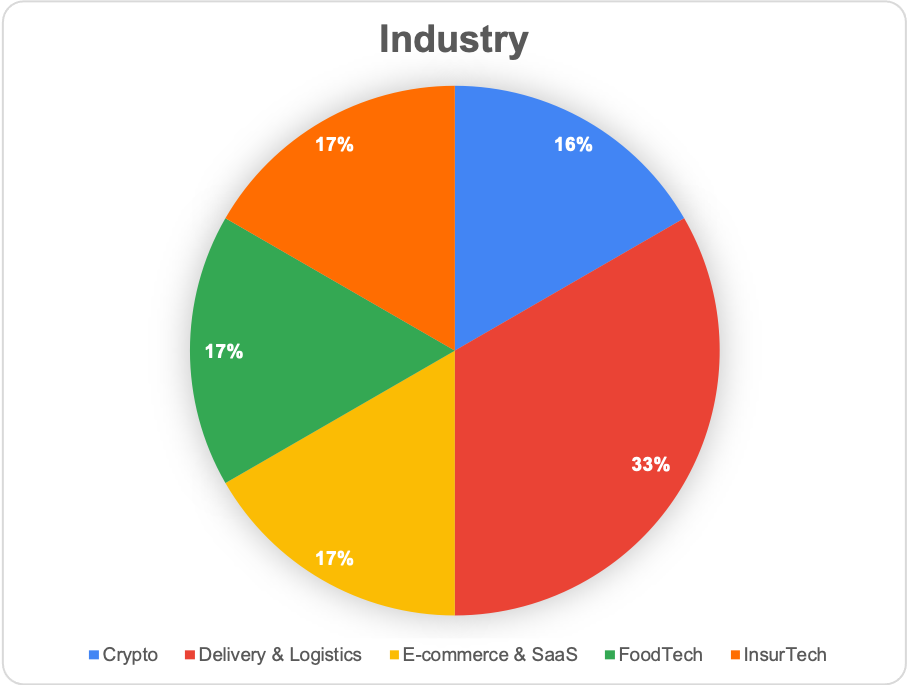
Sample Demographic
These charts show the type of startups that filled the survey to better understand who they are, from where, and which industry.
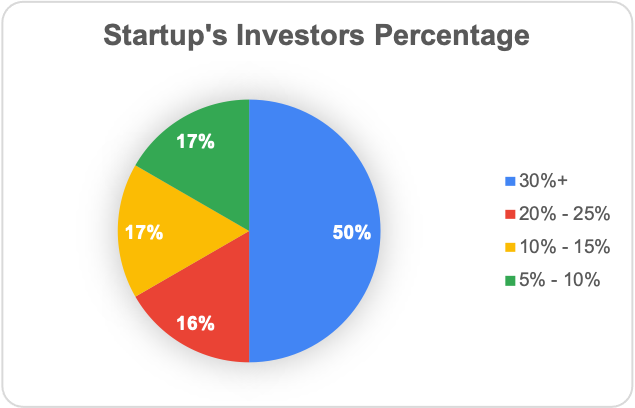
Investment Details
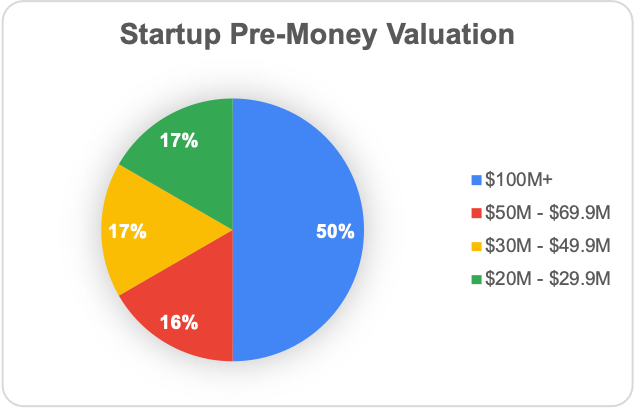
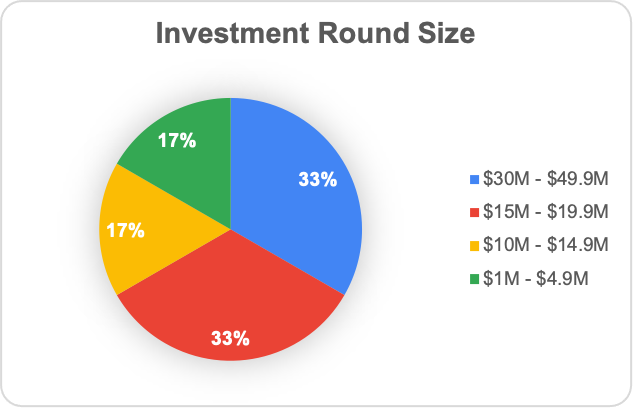
The following charts shows the average size of investments, pre-money valuations in the market, and how much investors own of the startup at this stage.
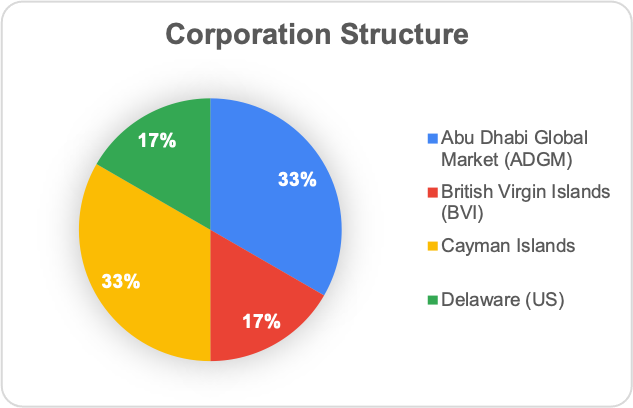
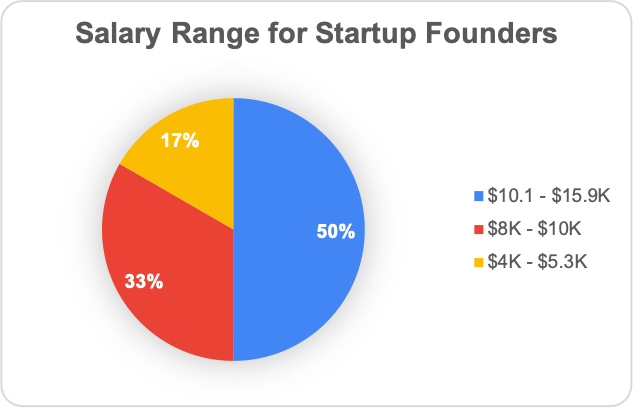
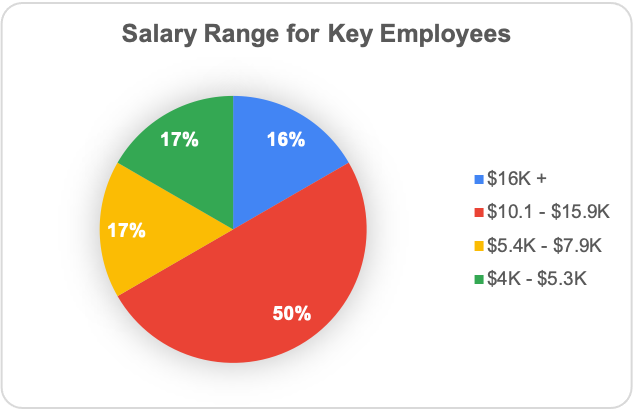
Startup Structure & Operations
These charts show common practices by startups when it comes to corporate structures , average salaries for founders & key employees, board structure sizes, and ESOP percentages in the startups.
Feedback from Startups on third party tools & companies


